Team Reports
Feature Detail
Description
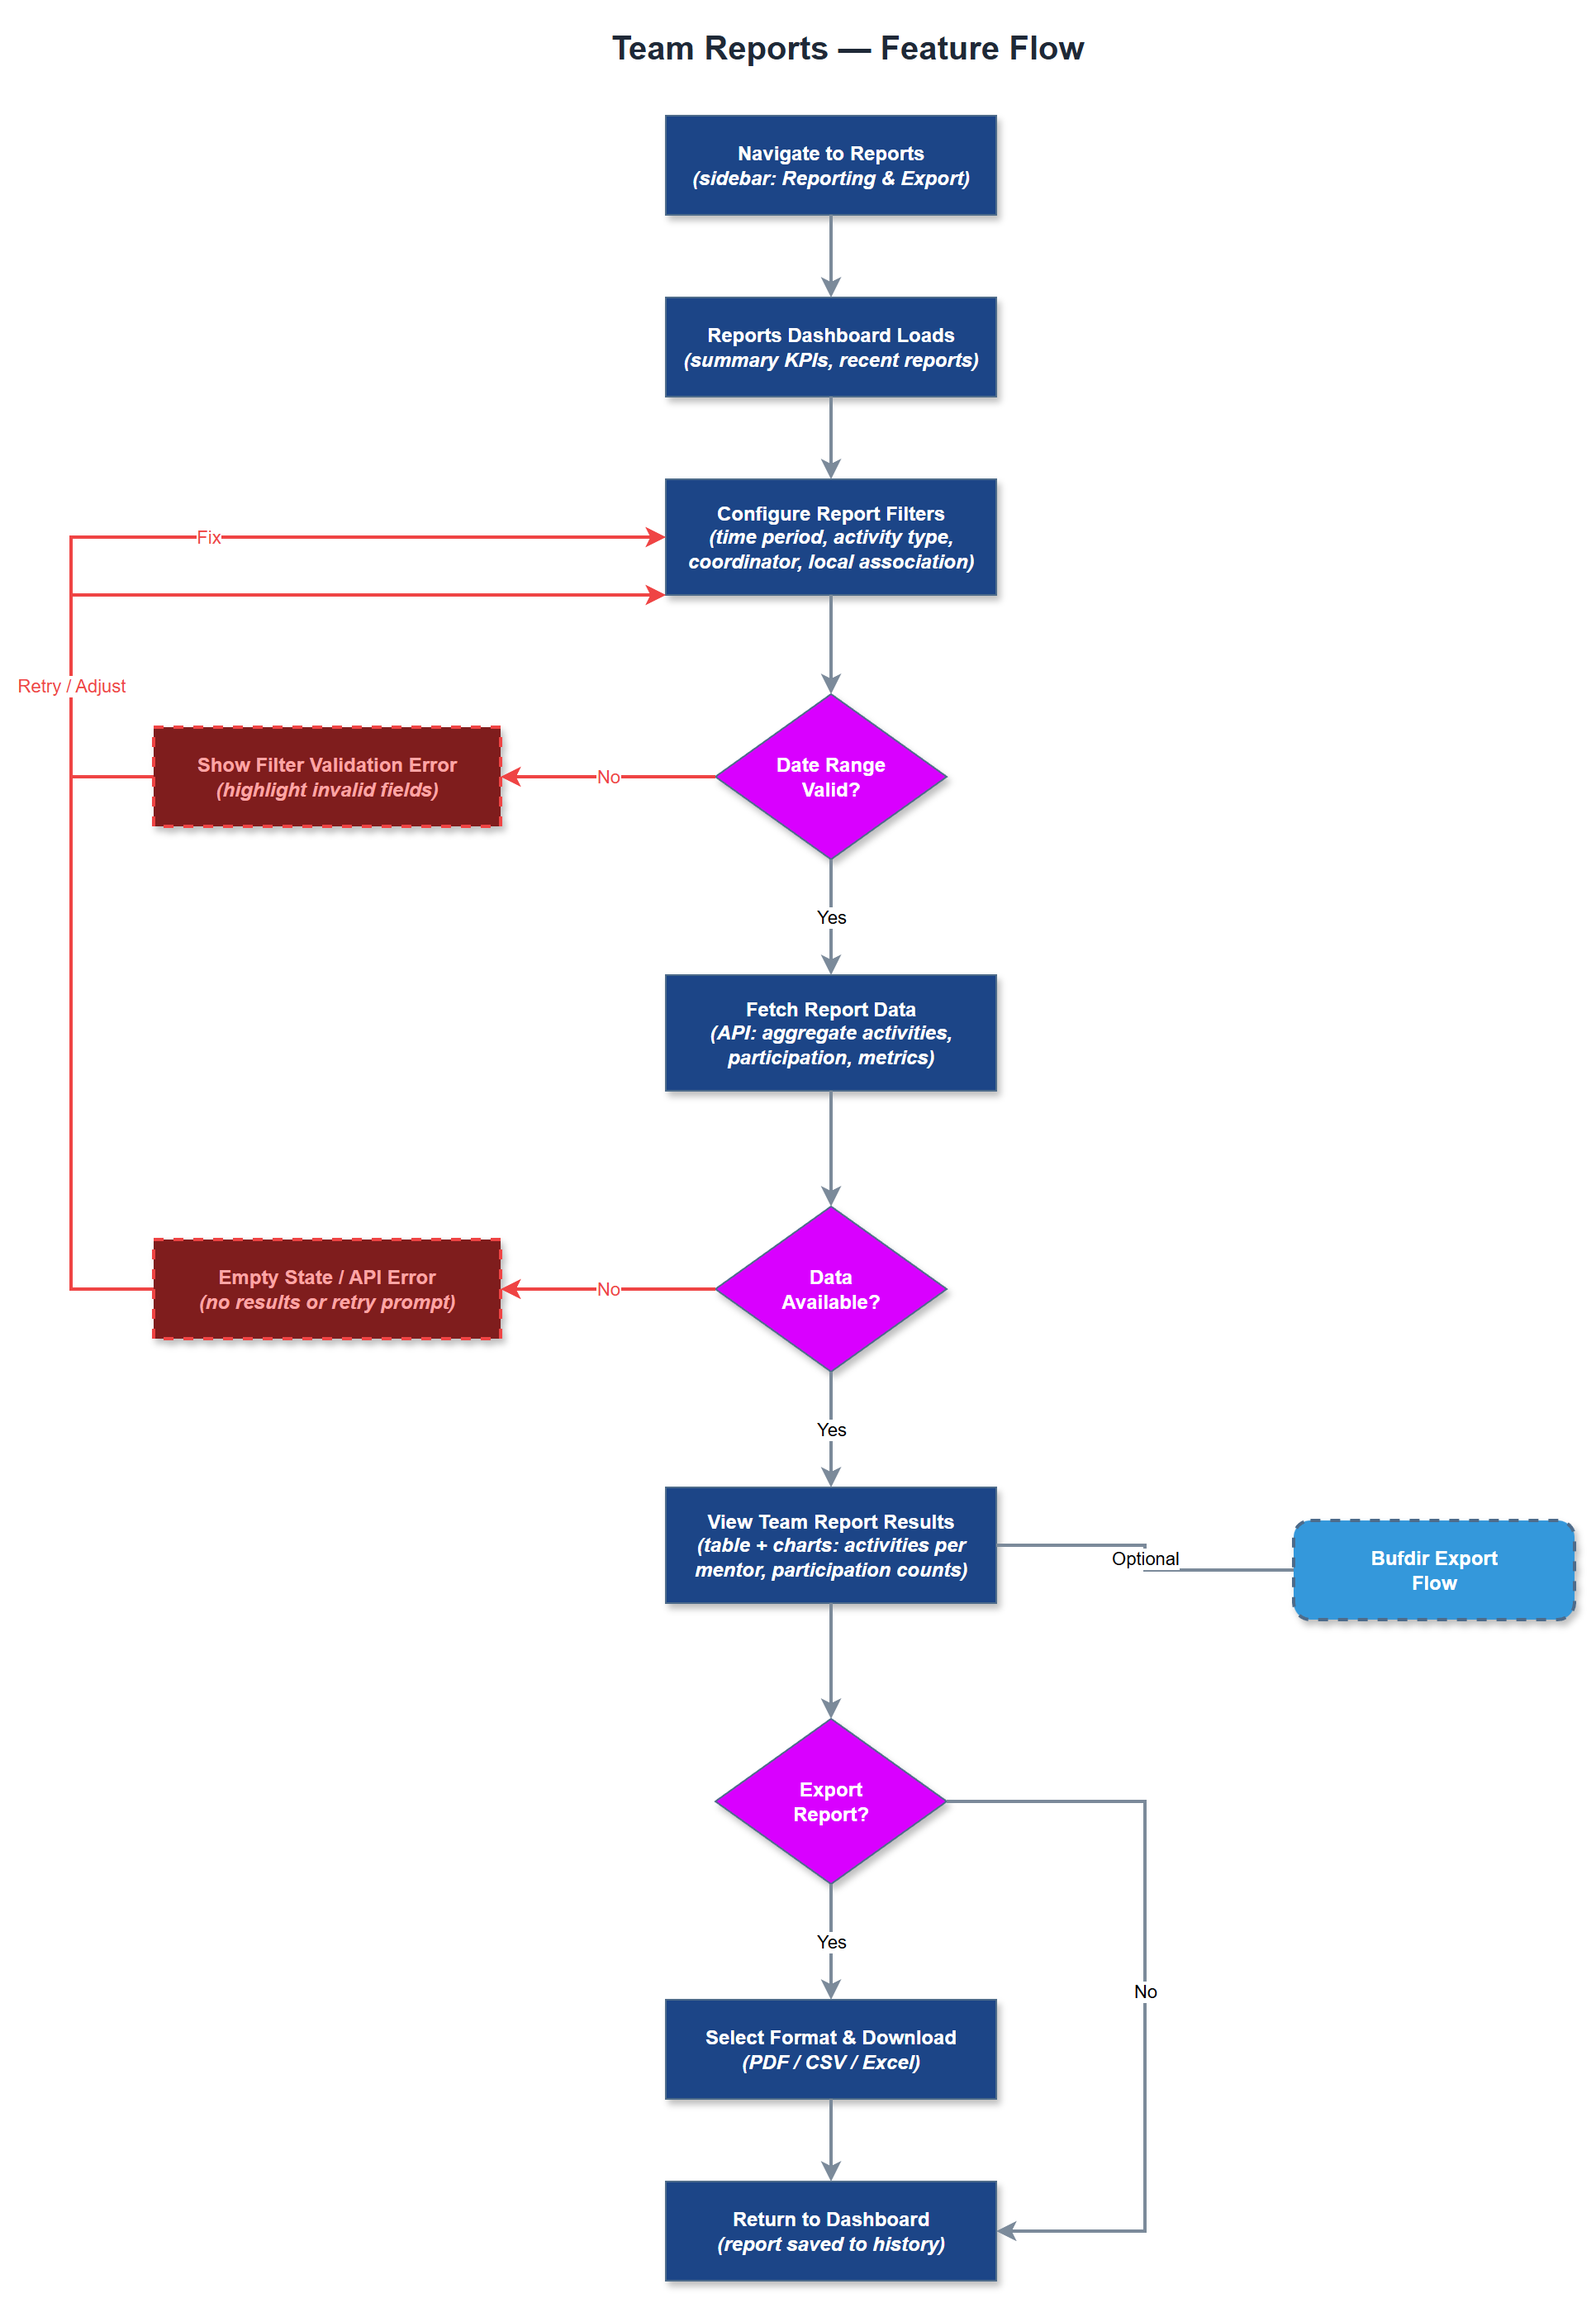
Team Reports provides coordinators and organization administrators with structured views of activity data across their peer mentors and local associations. The feature aggregates logged activities, participation counts, and engagement metrics into digestible report formats. Reports can be filtered by time period, activity type, coordinator, or local association, giving managers actionable insight into program performance. This feature is the primary tool for internal oversight and quality assurance within each organization.
User Flow
Analysis
Coordinating a distributed volunteer workforce without reliable reporting is operationally blind. Team Reports gives coordinators and org admins the visibility they need to identify underperforming areas, recognize high-engagement peer mentors, and allocate resources effectively. For organizations receiving Bufdir funding, demonstrating measurable program activity is a compliance requirement - Team Reports is the internal instrument that makes that data available before formal export. Without this feature, organizations must resort to manual aggregation from individual activity records, which is error-prone and time-consuming. Standardized team reporting also supports fair and transparent evaluation of peer mentors and local associations.
The reports dashboard page is a Next.js server-rendered page that queries the PostgreSQL database via the REST API using role-scoped filters - coordinators see only their local association's data, org admins see the full organization. The Report Generation Service aggregates raw activity records into summary statistics using SQL GROUP BY queries on the activities, users, and organizations tables. Filtering parameters (date range, activity type, user, association) are passed as query parameters and validated server-side. Reports are rendered as HTML tables with optional CSV download. The Reports Repository handles all read queries with pagination support. No third-party reporting library is required for MVP; chart rendering can be added iteratively.
Components (36)
Shared Components
These components are reused across multiple features
Service Layer (9)
Data Layer (12)
Infrastructure (7)
User Stories
No user stories have been generated for this feature yet.