Security Dashboard
Feature Detail
Description
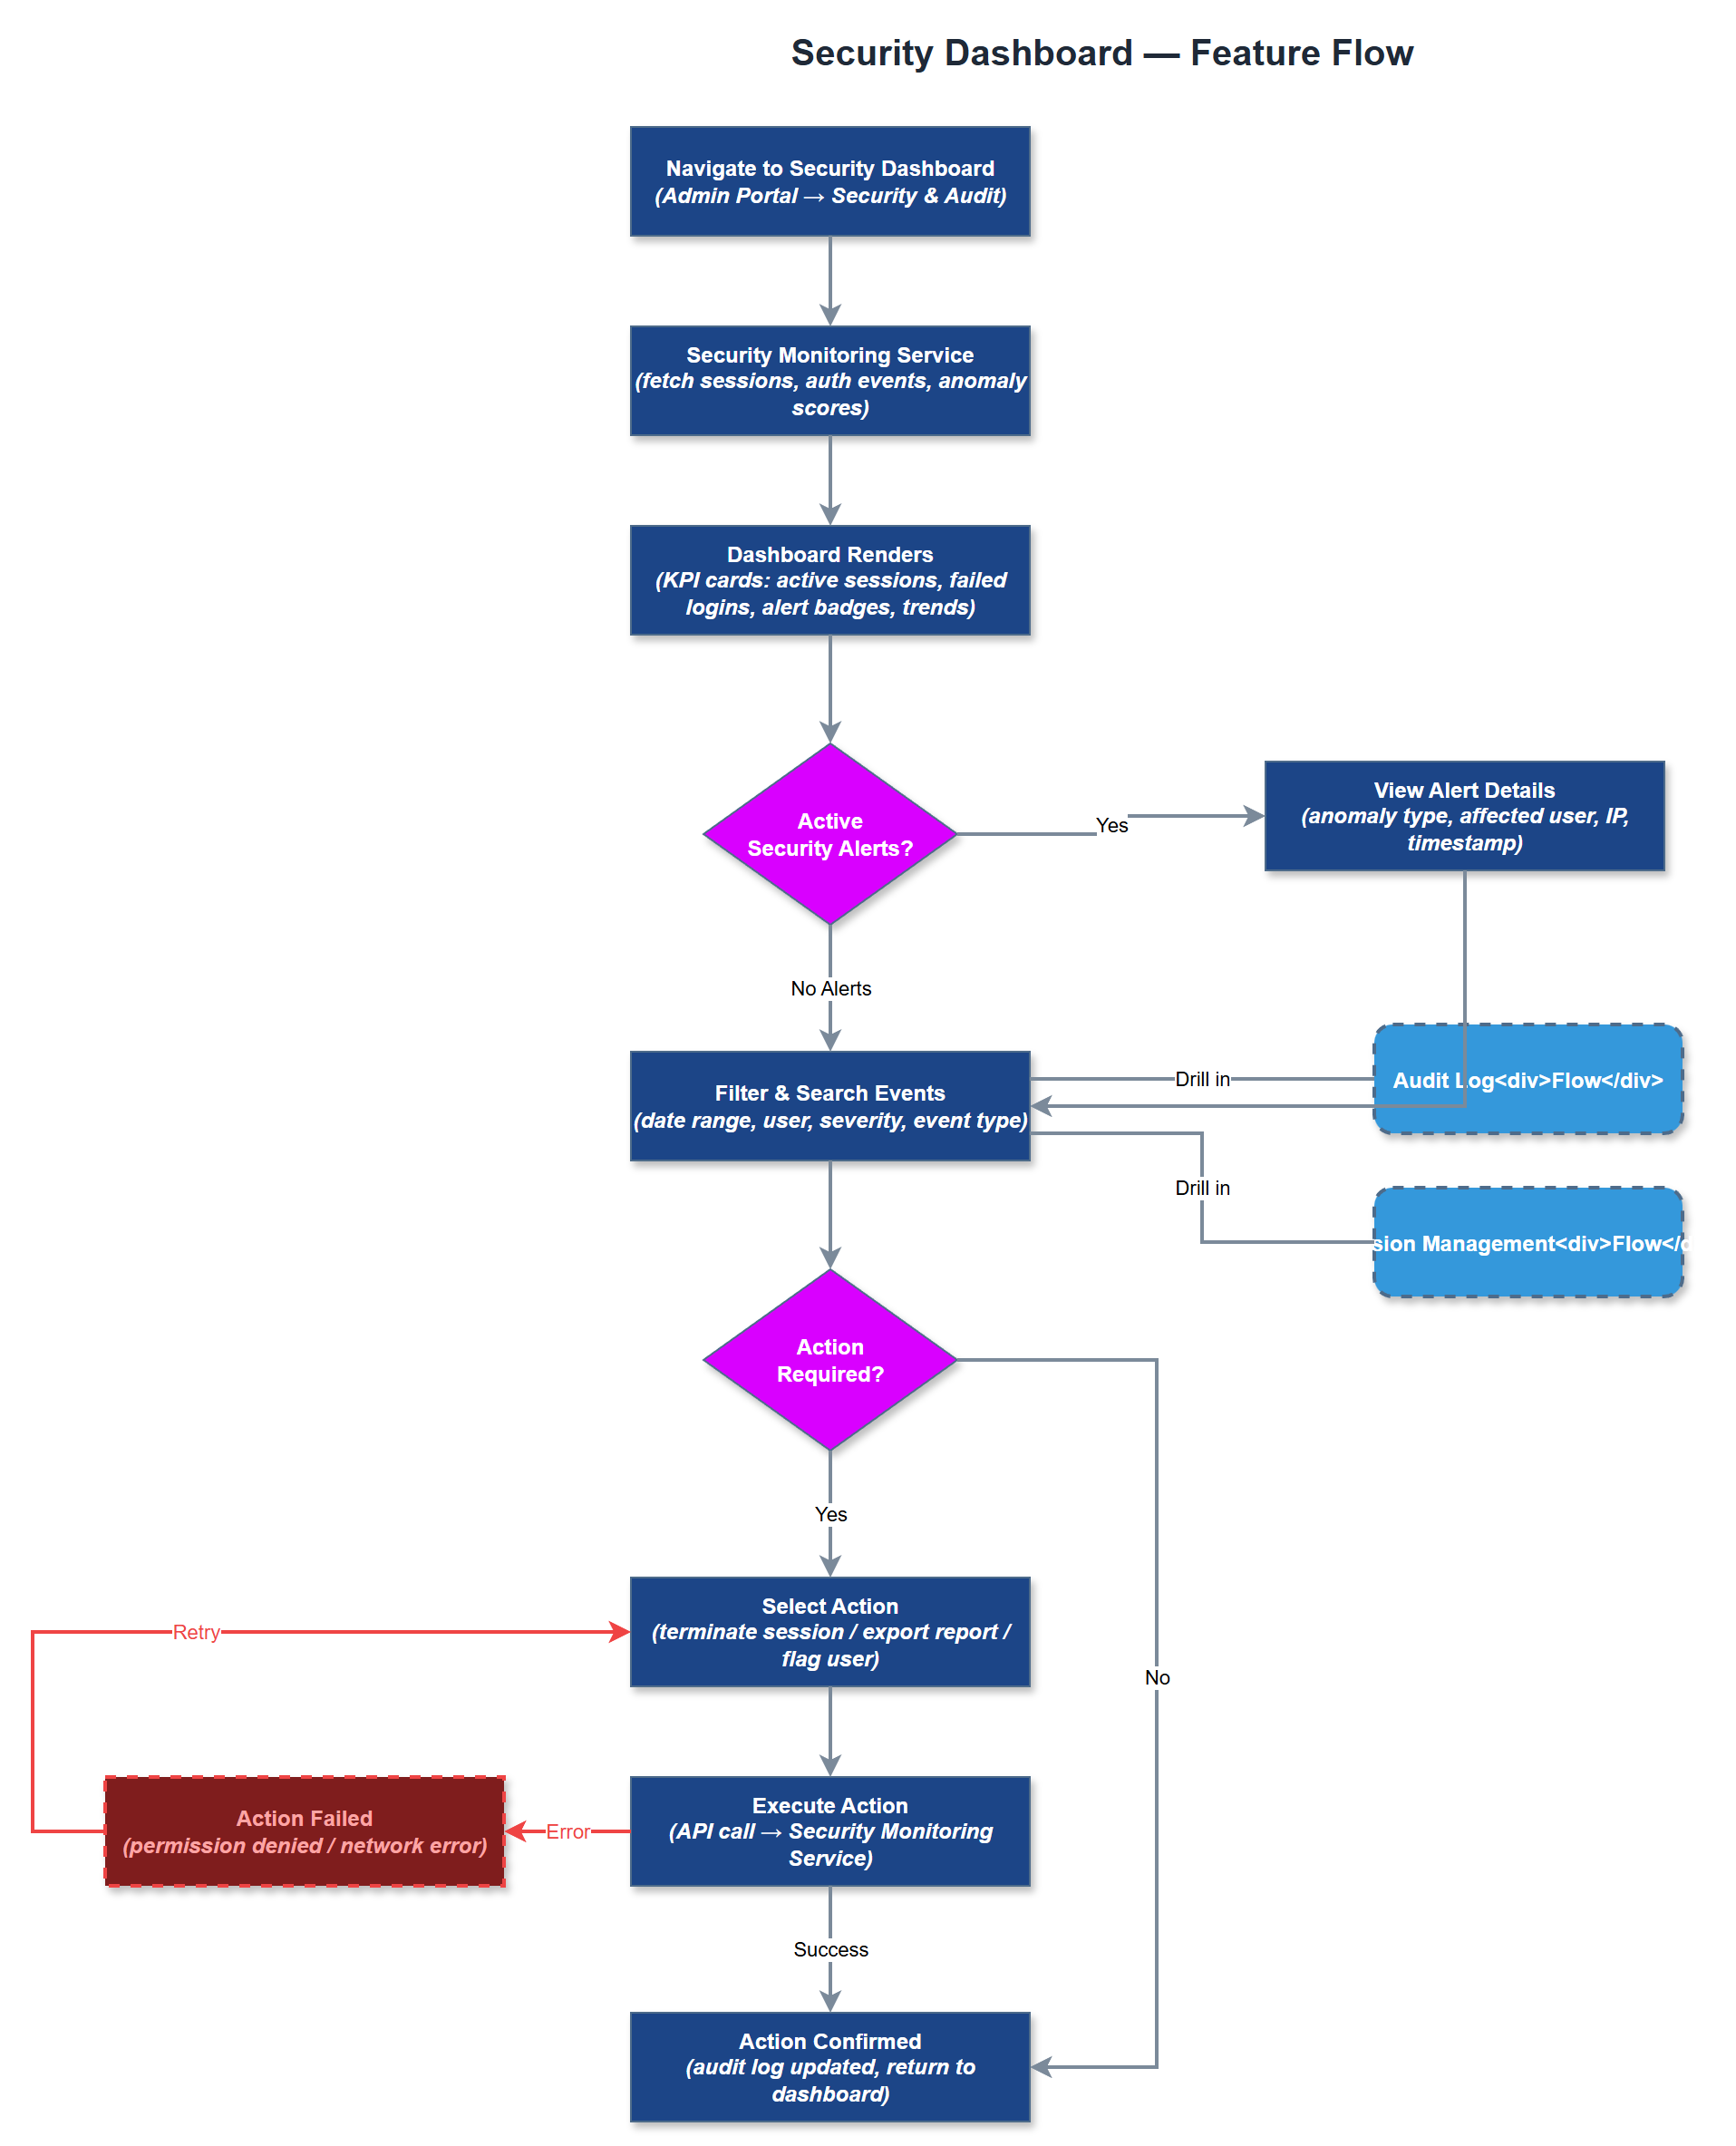
The Security Dashboard provides organization administrators and global admins with a centralized, real-time view of the security posture of the Meander platform. It surfaces active sessions, recent authentication events, anomaly alerts, and system-level security indicators in a single administrative interface. The dashboard is designed for proactive monitoring, enabling admins to detect suspicious activity patterns, review login attempts, and respond to potential threats before they escalate. It aggregates data from audit logs, session records, and authentication events to present actionable security intelligence.
User Flow
Analysis
Security visibility is a non-negotiable requirement for organizations handling sensitive personal data about vulnerable individuals, including health information and encrypted assignments. A centralized dashboard reduces the time-to-detect for security incidents, lowering the risk of data breaches and ensuring compliance with GDPR and Norwegian data protection regulations. For organization administrators, the dashboard builds confidence that the platform is being operated securely, which is critical for onboarding risk-averse organizations such as NHF and Blindeforbundet. It also demonstrates due diligence to regulatory authorities and auditors, supporting the platform's credibility as a trusted data processor.
The Security Dashboard is implemented as a Next.js server-rendered page within the admin portal, querying the PostgreSQL database for aggregated security metrics. Key data sources include the audit_logs table (filtered by security-relevant event types), the sessions table (active sessions, geographic anomalies), and authentication event logs. The dashboard should use server-side rendering for data freshness and avoid caching sensitive security data. Charts and KPIs should use lightweight charting libraries compatible with SSR. Access is restricted to Organization Admin and Global Admin roles via middleware-enforced RBAC. Refresh intervals and alert thresholds should be configurable per organization.
Components (37)
Shared Components
These components are reused across multiple features
Service Layer (9)
Data Layer (12)
Infrastructure (7)
User Stories
No user stories have been generated for this feature yet.