Reimbursement Overview
Feature Detail
Description
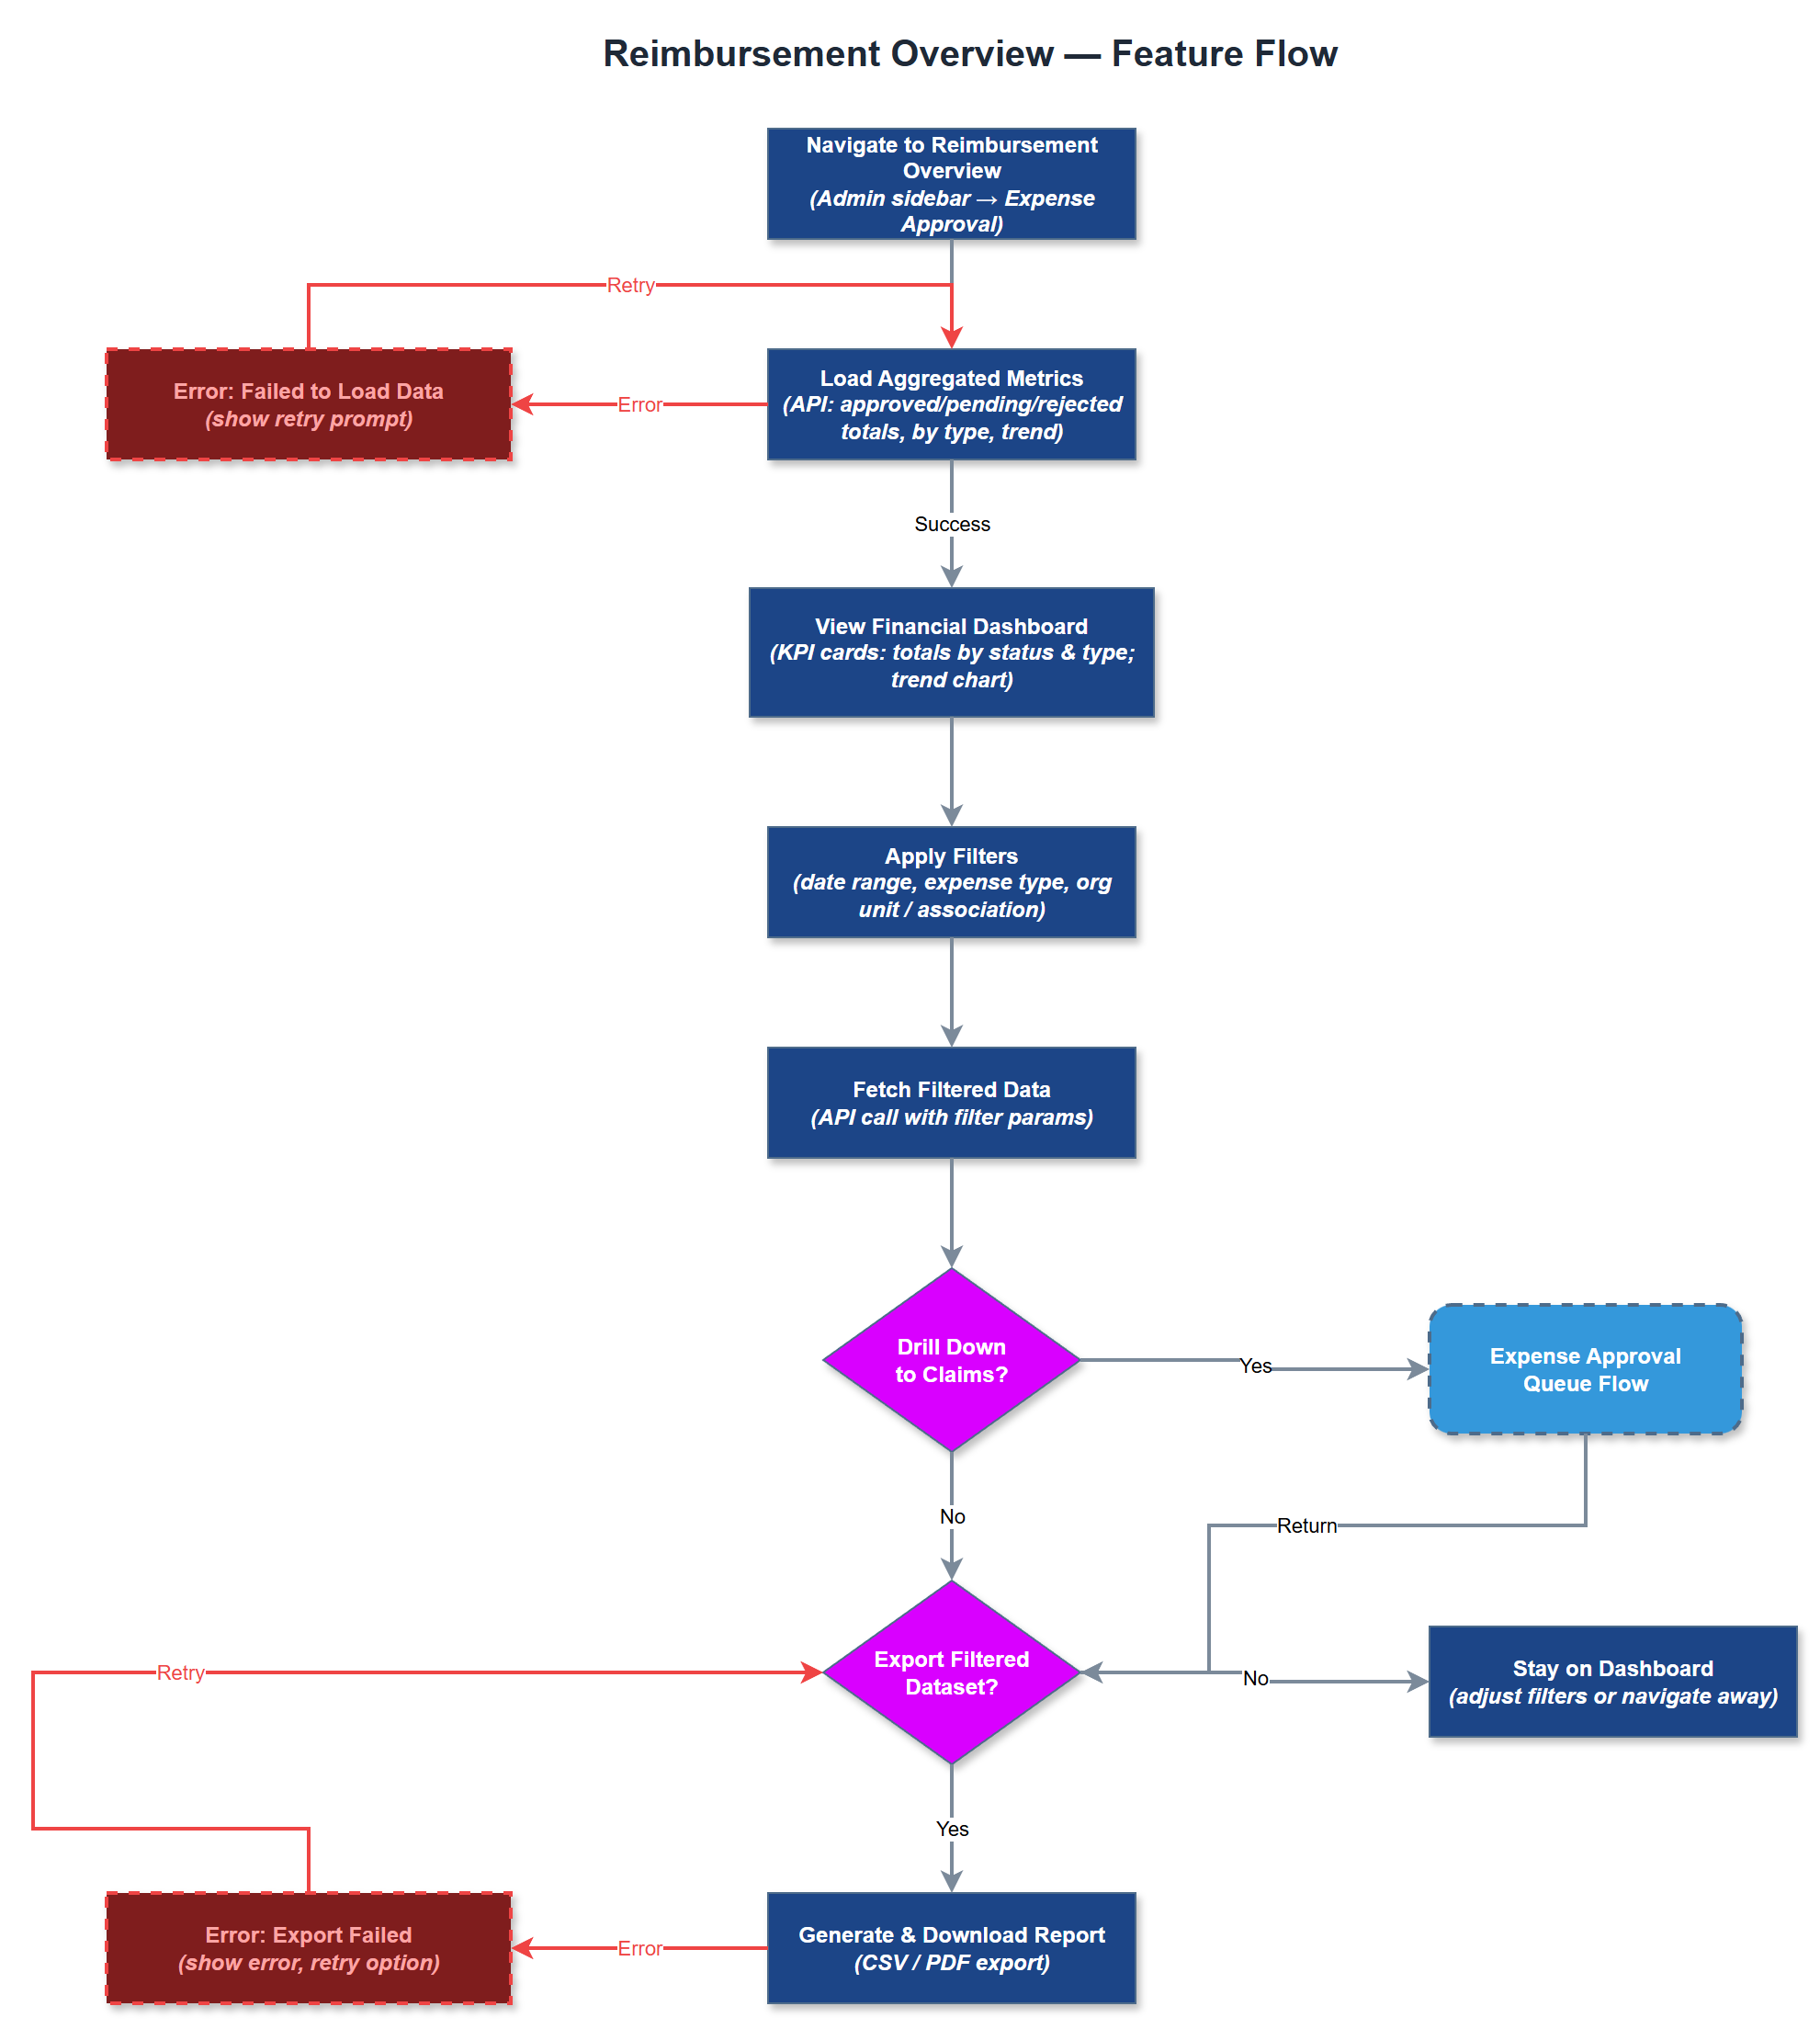
The Reimbursement Overview provides organization administrators and coordinators with an aggregated financial dashboard showing the status and totals of expense claims across their organization or local association. The overview surfaces key metrics - total approved, total pending, total rejected, amounts by expense type, and trends over time - giving decision-makers a clear picture of reimbursement activity without requiring manual report generation. Drill-down capabilities allow administrators to navigate from summary figures to the underlying individual claims. The overview also supports export of filtered datasets for integration with accounting systems and financial reporting workflows.
User Flow
Analysis
Without a consolidated reimbursement view, administrators must manually compile expense data from individual approvals or external spreadsheets to understand their organization's financial exposure and reimbursement patterns. This overhead is both time-consuming and error-prone, particularly for organizations with large volunteer networks and high activity volumes. A purpose-built overview eliminates this manual work, giving administrators instant visibility into pending financial obligations, approval backlogs, and historical spend patterns. This supports better budget planning, faster detection of anomalies or abuse, and streamlined handoff to accounting systems like Xledger or Dynamics. For Bufdir-funded organizations, the ability to report on reimbursement totals by period is also directly relevant to grant reporting requirements.
The reimbursement overview is a server-side rendered Next.js dashboard page that aggregates data from the expenses and reimbursement_approvals tables via dedicated API endpoints returning pre-computed summary statistics. Aggregations are computed at query time using SQL GROUP BY on status, expense_type_id, and date ranges, with organization-scoped filtering enforced at the API layer. Time-series trend data is rendered using a lightweight charting library (e.g., Recharts). Drill-down navigation links from summary cards to the filtered expense approval queue. Export functionality generates CSV files server-side from the same filtered dataset, with content-disposition headers for direct download. Role scoping ensures coordinators see only their local association's data while org admins see the full organization. All queries are indexed on organization_id and status for performance.
Components (35)
Shared Components
These components are reused across multiple features
Service Layer (9)
Data Layer (12)
Infrastructure (7)
User Stories
No user stories have been generated for this feature yet.