Dashboard KPIs
Feature Detail
Description
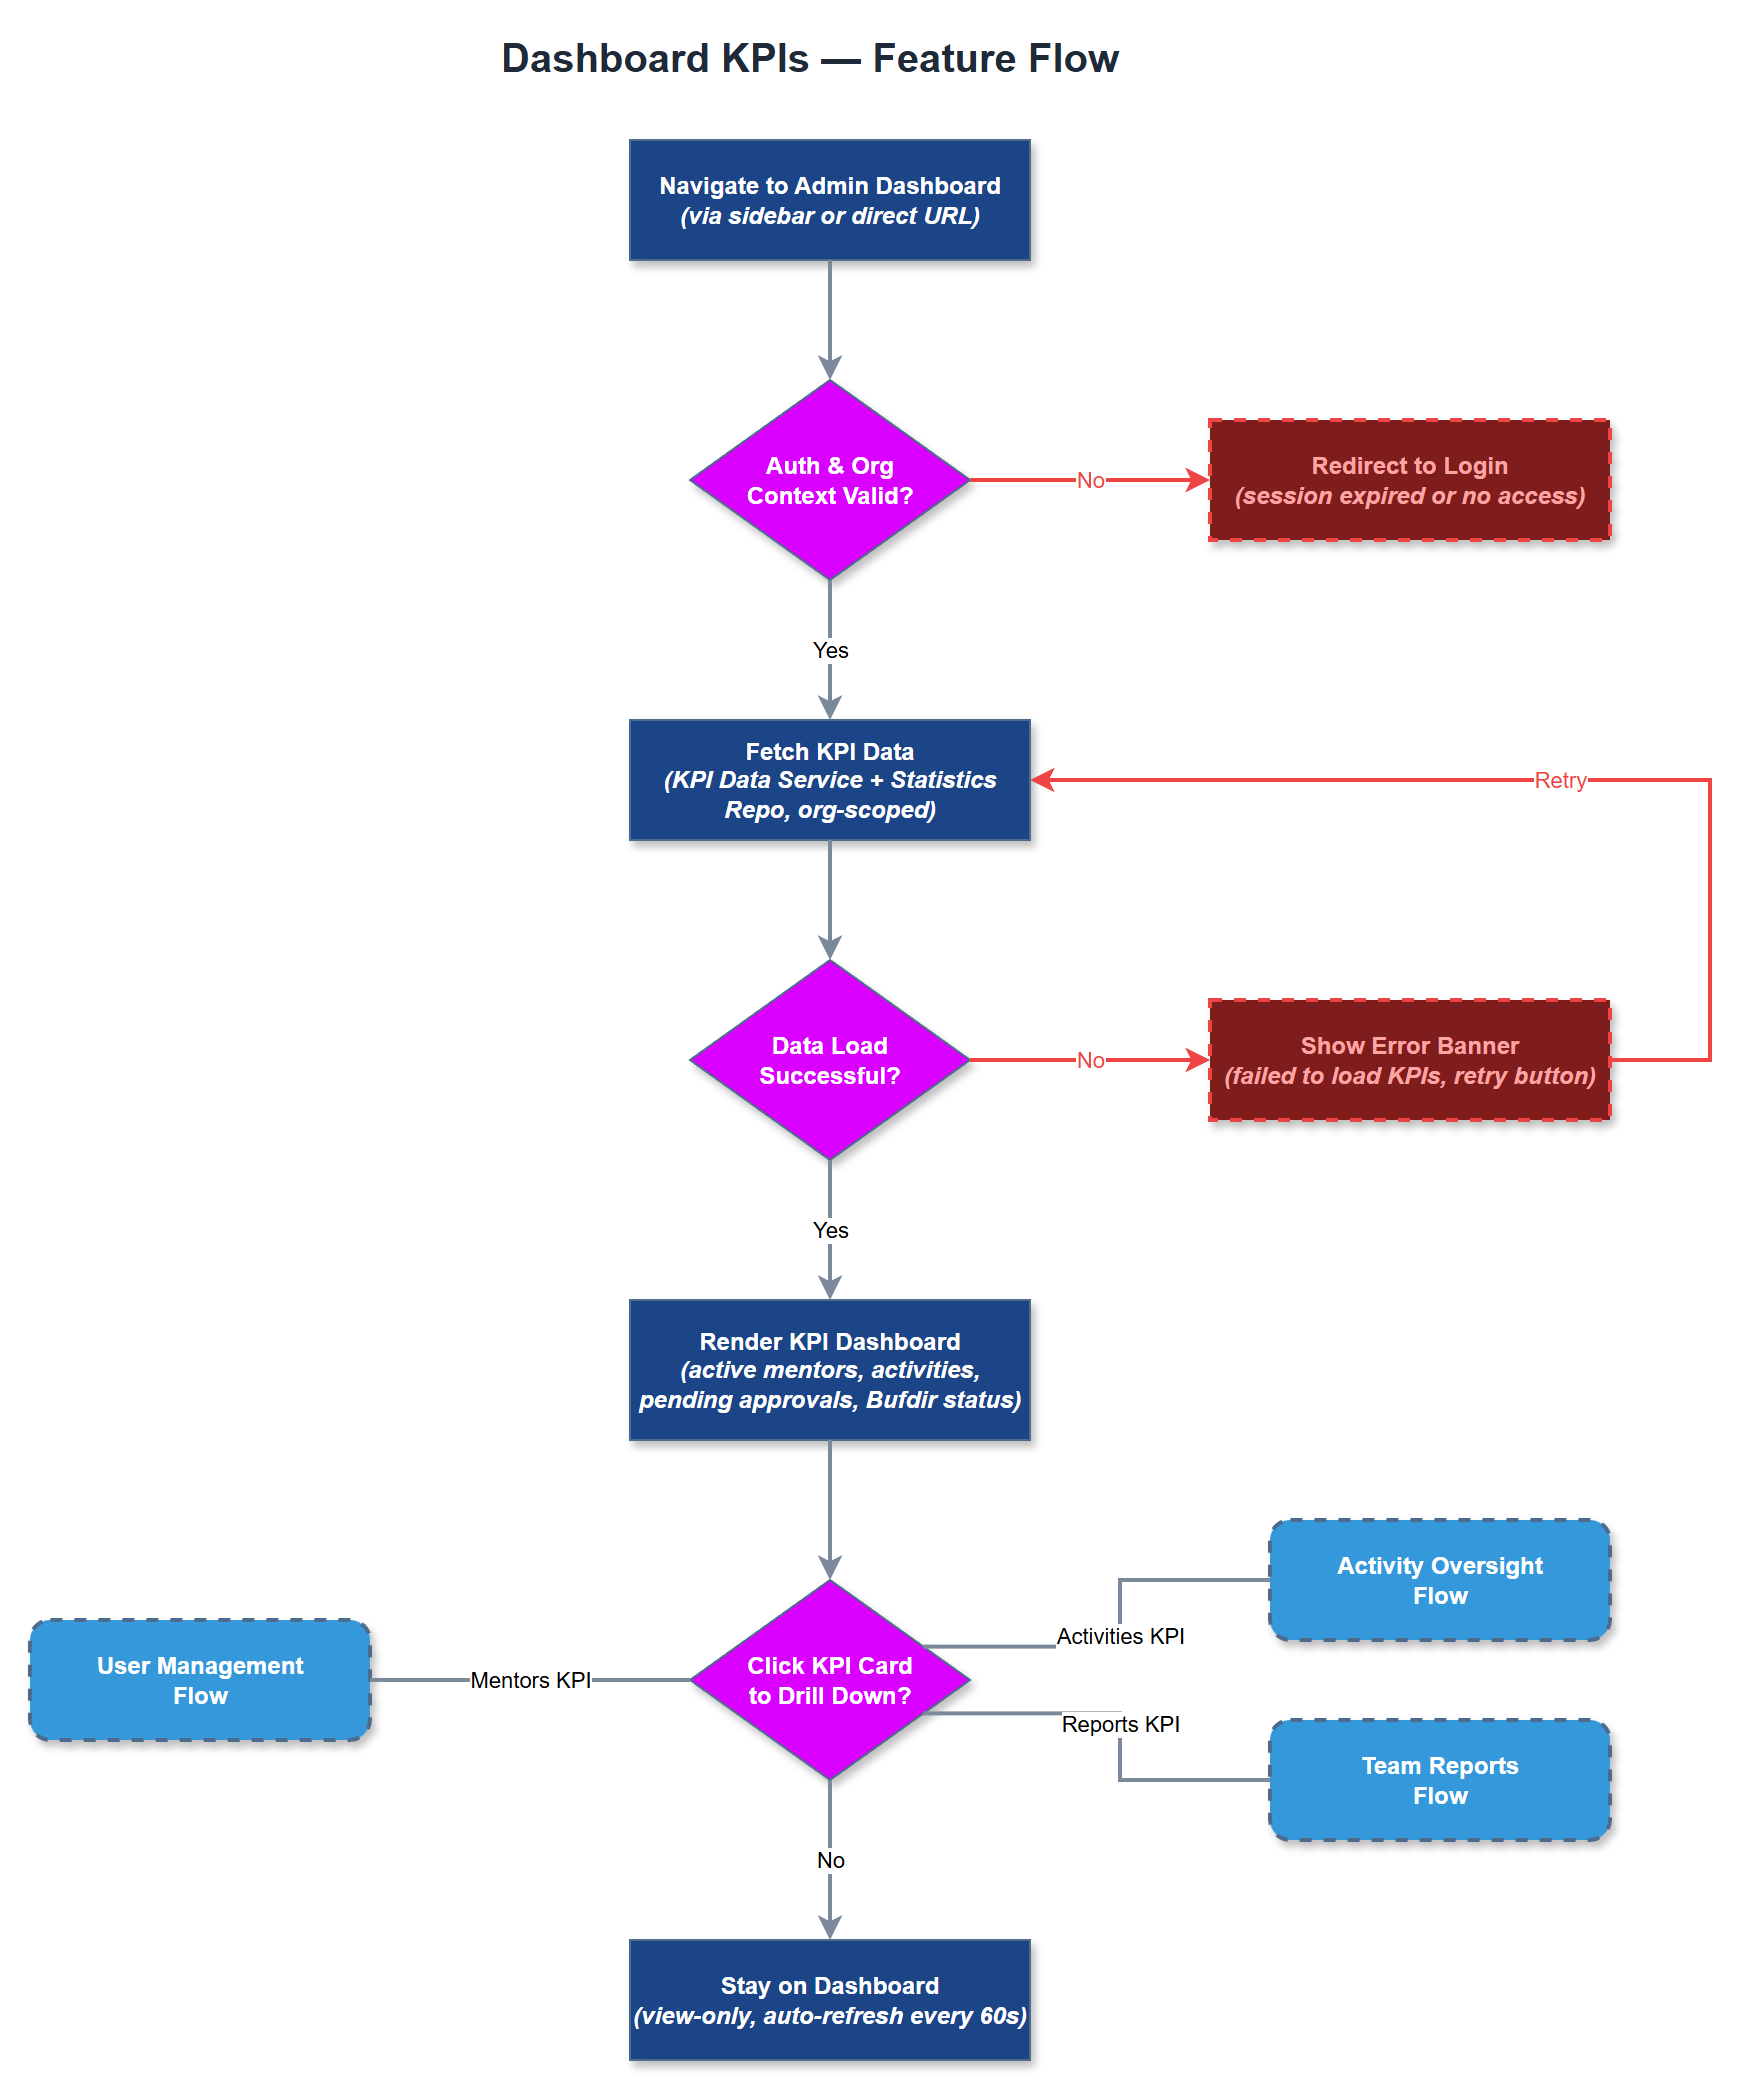
The Dashboard KPIs feature provides organization administrators and coordinators with a real-time overview of the most critical performance indicators for their organization. This includes metrics such as total active peer mentors, number of activities registered in the current period, pending approvals, and Bufdir reporting status. The dashboard is designed for at-a-glance decision-making, presenting data in a clear, visual format using cards, charts, and trend indicators. All KPI data is scoped to the user's organization, enforcing strict multi-tenancy boundaries so no cross-organization data leakage occurs.
User Flow
Analysis
Organization administrators currently lack a single consolidated view of their program's health, forcing them to manually compile data from spreadsheets and email reports. This KPI dashboard eliminates that overhead and gives coordinators and admins instant situational awareness without navigating through multiple screens. From a strategic perspective, visible impact metrics support internal reporting to boards and stakeholders, strengthen Bufdir compliance confidence, and help coordinators identify problems such as low activity registration rates before they become critical. The feature directly reduces administrative time spent on status gathering and makes the platform indispensable for day-to-day organizational management.
KPI data is aggregated server-side via Next.js API routes querying PostgreSQL using efficient aggregate SQL queries with organization-scoped WHERE clauses to enforce tenant isolation. Each KPI card maps to a dedicated query optimized with indexes on organization_id, created_at, and status columns. Data freshness is managed through server-side rendering with short-lived caching (ISR or stale-while-revalidate) to balance performance with accuracy. The frontend renders KPI cards using reusable stat card components consistent with the admin portal design system. Role-based visibility rules ensure coordinators see their local association scope while org admins see the full organization view.
Components (35)
Shared Components
These components are reused across multiple features
Service Layer (9)
Data Layer (12)
Infrastructure (7)
User Stories
No user stories have been generated for this feature yet.