Cost Comparison
Feature Detail
Description
The Cost Comparison feature presents a side-by-side breakdown of the estimated costs of running a peer mentor program with Meander versus without it, using manual or fragmented tooling. The widget highlights administrative overhead, error correction time, and reporting labor costs under the status quo, contrasted against Meander's subscription cost and projected efficiency gains. It is intended to support the financial justification phase of the buyer journey, giving procurement and finance stakeholders a clear cost-benefit narrative.
User Flow
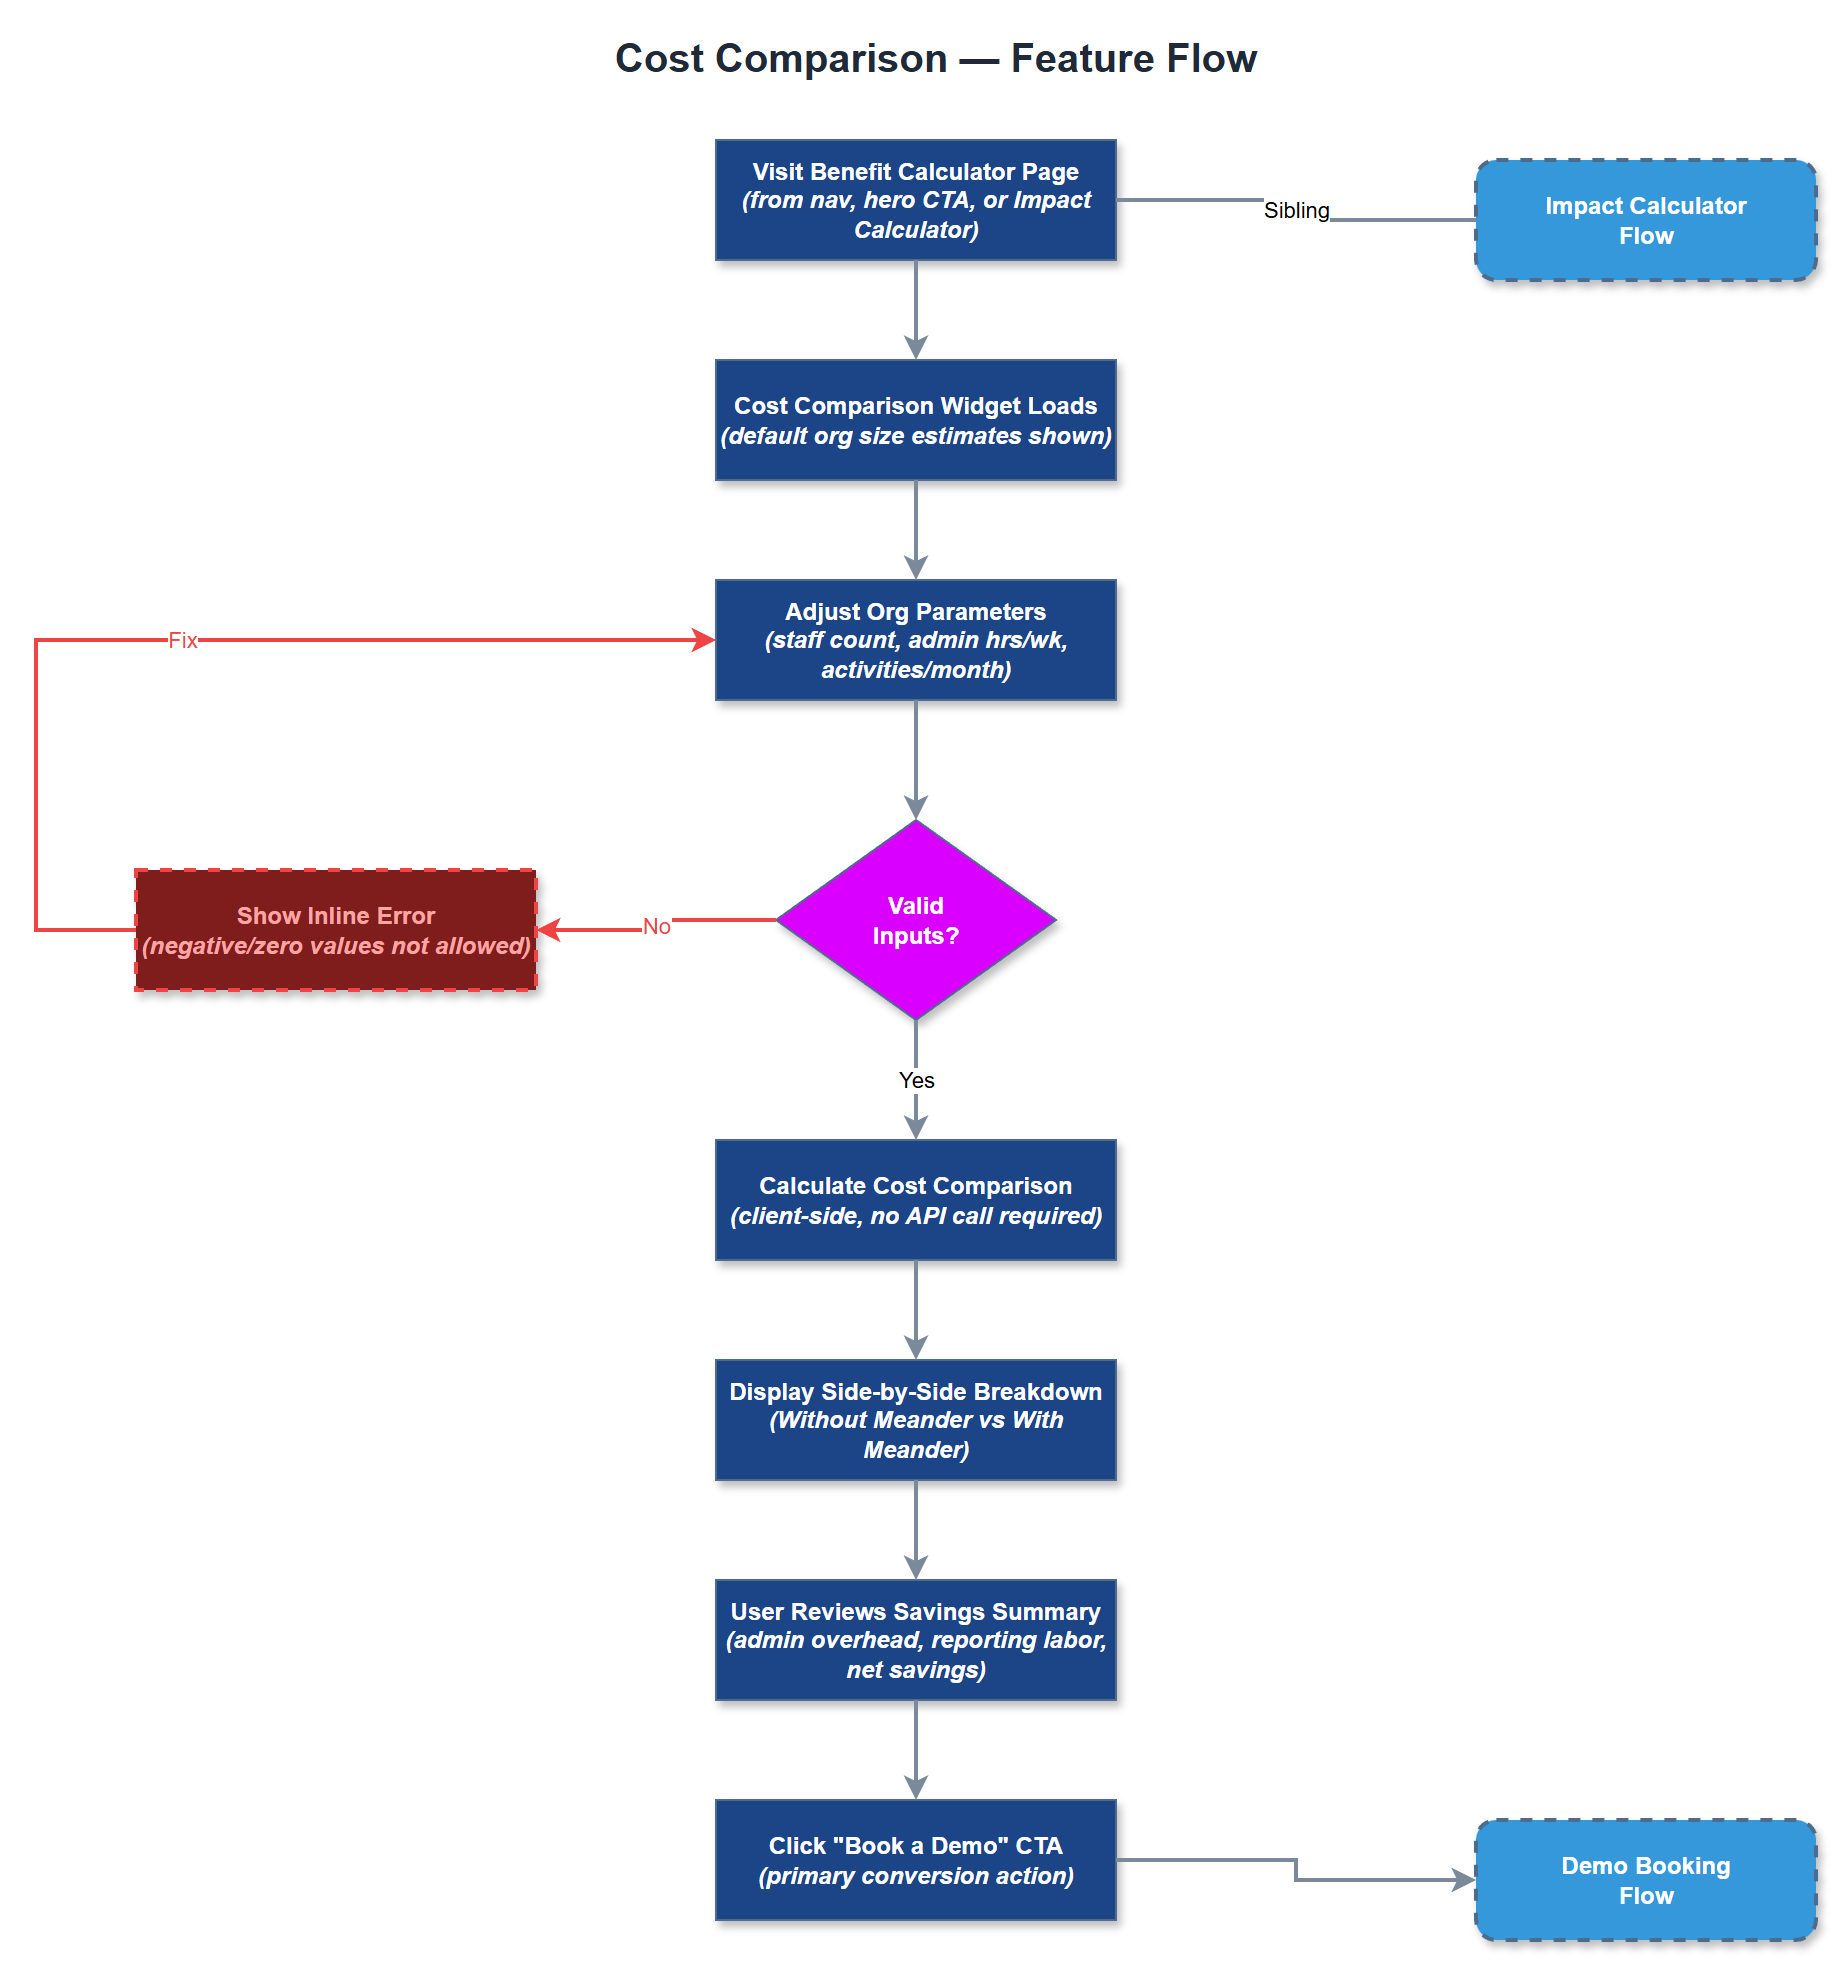
Analysis
Many organizations evaluating Meander will involve finance or procurement stakeholders who require explicit cost justification before approving a new software subscription. The Cost Comparison widget provides a ready-made financial narrative that sales teams and organizational champions can use internally without needing to build custom spreadsheets. By anchoring the conversation around total cost of ownership rather than subscription price alone, the feature reframes the buying decision in Meander's favor and reduces price sensitivity. For Norse Digital Products, this asset reduces sales cycle friction and increases the close rate among organizations with formal procurement processes, directly impacting revenue growth.
The Cost Comparison component builds on inputs from the Impact Calculator and adds a configurable Meander subscription cost tier. Output is rendered as a two-column comparison table or visual bar chart showing current-state costs versus Meander costs over a 12-month horizon. Subscription pricing tiers should be stored in a configuration file to allow easy updates without code changes. The component should support both a simplified view (total savings) and an expanded view (line-item breakdown) toggled by user interaction. Implementation should use a charting library such as Recharts or Chart.js for the visual representation. As with the Impact Calculator, full WCAG 2.2 AA compliance is required, and all chart data must also be available in accessible tabular form.
Components (35)
Shared Components
These components are reused across multiple features
Service Layer (9)
Data Layer (12)
Infrastructure (7)
User Stories
No user stories have been generated for this feature yet.